
Lake Samsonvale Monitoring Program
Monitoring the Health of the fishery
The Pine Rivers Fish Management Association (PRFMA) diligently collects and analyses data from various sources to monitor the health of the fishery at Lake Samsonvale. This data plays a crucial role in guiding the stocking program, evaluating the success of initiatives aimed at enhancing the recreational fishery, and fulfilling reporting obligations to relevant authorities.
By gathering and interpreting this information, the PRFMA ensures that management decisions are based on evidence, supporting sustainable fishing practices, and fostering a thriving fishery for both current and future generations. We also invite all users of Lake Samsonvale to participate in our data collection programs, as their contributions significantly enhance the accuracy and breadth of our research.
Sources of Data
1. Catch Cards
All Vessel Permit Scheme (VPS) permit holders are required to complete catch cards as part of the login/logout process for each outing. These cards capture essential data, including:
• Total catch by species
• Angler effort (e.g., hours spent fishing)
• Frequency of visits
• Other relevant details about the fishing activity
This information provides a broad overview of fishing trends, helping to identify patterns in species abundance and fishing pressure over time.
2. Record Sheets with Lengths and Weights
A select group of PRFMA members and permit holders meticulously measure and weigh their catch throughout the year, documenting key metrics such as:
• Catch distribution across size groups
• Average lengths and weights of fish by species
This data is further enriched through periodic Survey Events, which focus on collecting detailed measurements to assess fishery health.
3. Tagging Program
Tagging efforts contribute valuable insights into fish growth and movement patterns. Historically, the program has focused on Australian Bass, but it has recently expanded to include species such as Golden Perch (Yellow Belly) and Saratoga. These tagging efforts are crucial for understanding species-specific behaviours and guiding targeted management strategies.
4. Otolith Collection
Fish otoliths (ear bones) provide definitive age data, akin to tree rings, through the analysis of annual growth rings. This data offers critical insights into the impact of environmental and seasonal factors on fish growth. Otoliths have been collected from Australian Bass and Golden Perch, forming the backbone of long-term fishery monitoring.
A related research initiative is exploring the use of fin clips to determine fish age, comparing this method with the traditional otolith analysis to develop less invasive techniques for age determination.
5. Saratoga Monitoring Project
Recent years have seen the commencement of a dedicated project to monitor Saratoga, an iconic species gaining popularity among anglers. The project aims to gather information on:
• Saratoga growth rates
• Movement patterns within the lake
As little is currently known about this species, the data collected will inform decisions on stocking quantities, release strategies, and long-term management to ensure the sustainability of this highly sought-after fish.
________________________________________
Data Presentation and Analysis
The data collected from these various programs is analysed and presented in formats that facilitate decision-making and inform stakeholders. This includes visual representations such as graphs, charts, and tables that showcase trends
Through these efforts, the PRFMA remains committed to maintaining a sustainable and enjoyable fishery at Lake Samsonvale. We encourage anglers and lake users to participate in these programs, as collective contributions make a significant difference in safeguarding the future of this vital resource.
 Catch Cards
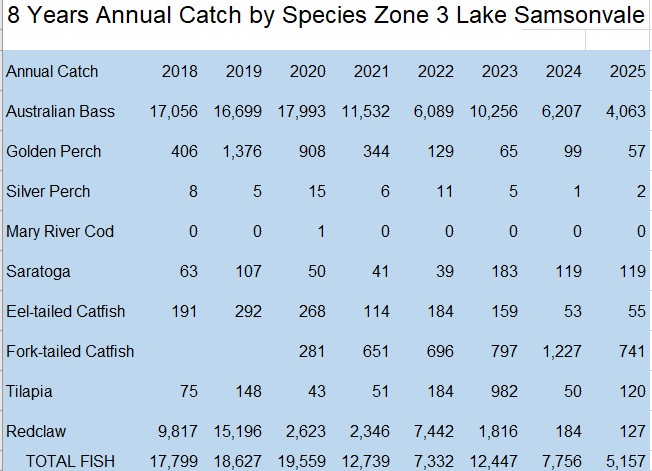
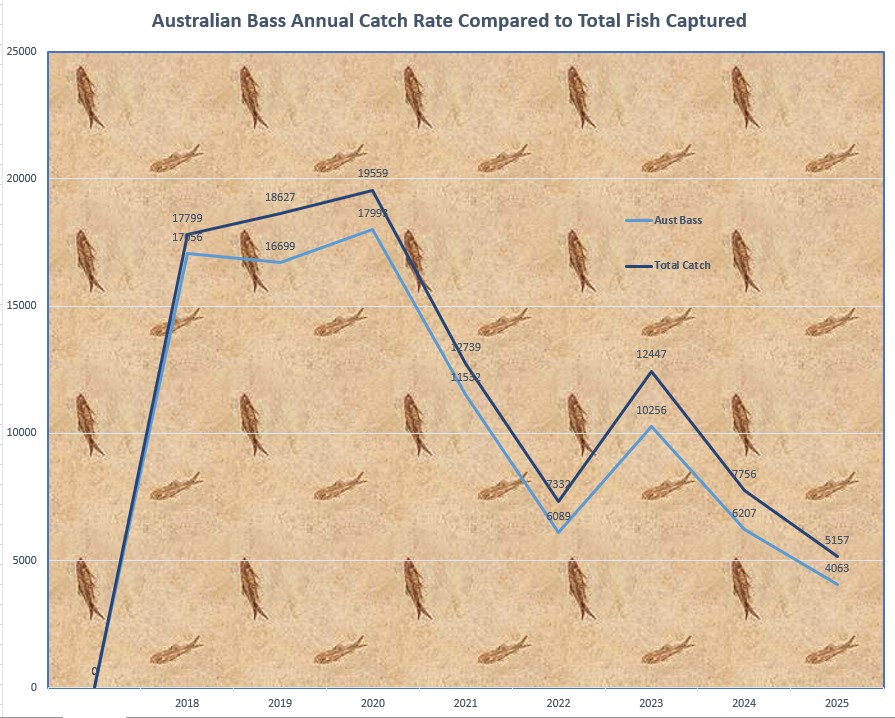
This above shows the catch by species for a eight-year period with data taken from the Catch Cards.
In late 2017, a strategic decision was made to diversify the fishery at Lake Samsonvale. Historically known as a Bass fishery, the lake was already well-regarded as a family-friendly destination. However, it was determined that diversifying the fishery could broaden its appeal and attract a wider audience, including anglers with varied interests and skill levels. As part of this initiative, changes were implemented in the fish-stocking policy, allowing for the introduction and management of a wider range of fish species. This adaptive approach enables ongoing monitoring of the outcomes and provides flexibility to refine the policy based on observed results and feedback.
Although our data collection currently excludes catches from Forgan Cove (Zone 2 Lake Samsonvale) and land-based fishing activities, the significant Bass catch numbers remain a gratifying indicator of success. These results highlight the effectiveness of the Pine Rivers Fish Management Association (PRFMA) in its fish-stocking efforts and its commitment to maintaining a thriving fishery. The strong presence of Bass serves as a testament to the sustained efforts of the PRFMA, even as the fishery evolves to meet the changing needs and expectations of its visitors.
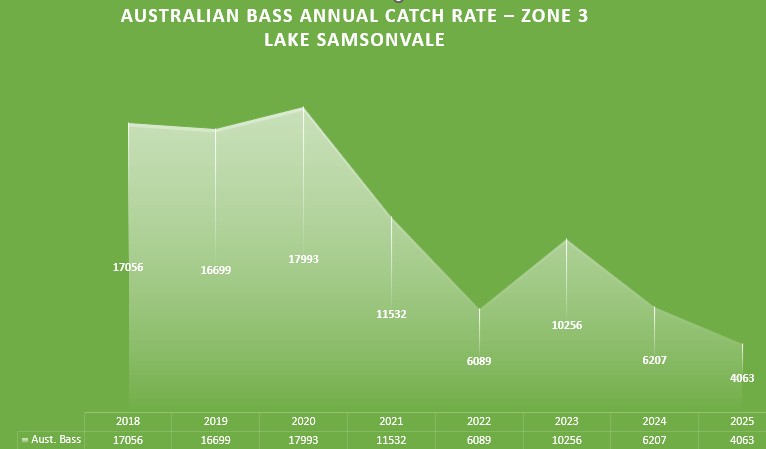
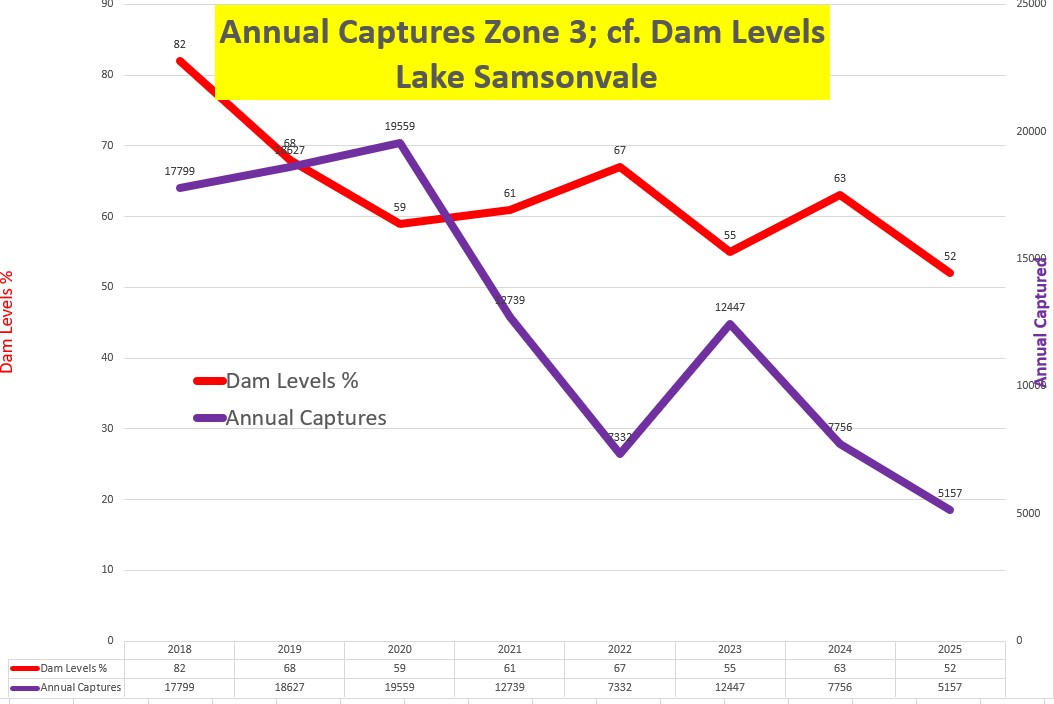
Catch vs Stocking Rate
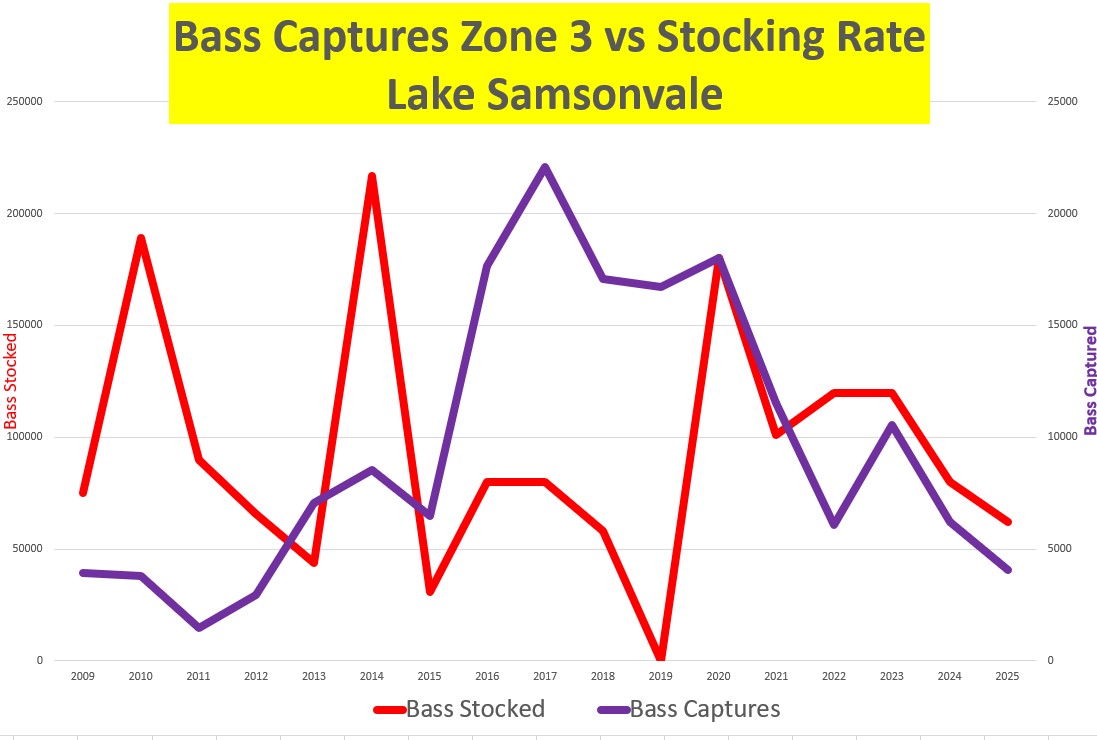
As anticipated, there is a clear correlation between stocking efforts and catch rates – the more we stock, the higher the catch numbers tend to be. However, this relationship is not linear, and there are important ecological and management considerations to keep in mind. Over-stocking a fishery can have detrimental consequences, potentially leading to resource competition, stress on the ecosystem, and even a collapse of the fishery. Striking the right balance in stocking rates is therefore critical to maintaining a healthy and sustainable fishery.
The accompanying chart illustrates the significant rise in Bass catch numbers several years after the high stocking effort in 2014. This delayed response demonstrates the “surge” effect, where variations in stocking rates result in observable changes in catch rates over time. By carefully analysing this data, we gain valuable insights into the lag time between stocking events and their impact on fish populations and fishing success.
This information is crucial for making informed decisions about future stocking strategies. It allows us to fine-tune our approach to ensure optimal fishery health while maintaining a productive and enjoyable experience for anglers. Monitoring these trends over time is an essential part of adaptive management, helping us achieve both ecological sustainability and recreational value.
Golden Perch (Yellow Belly)
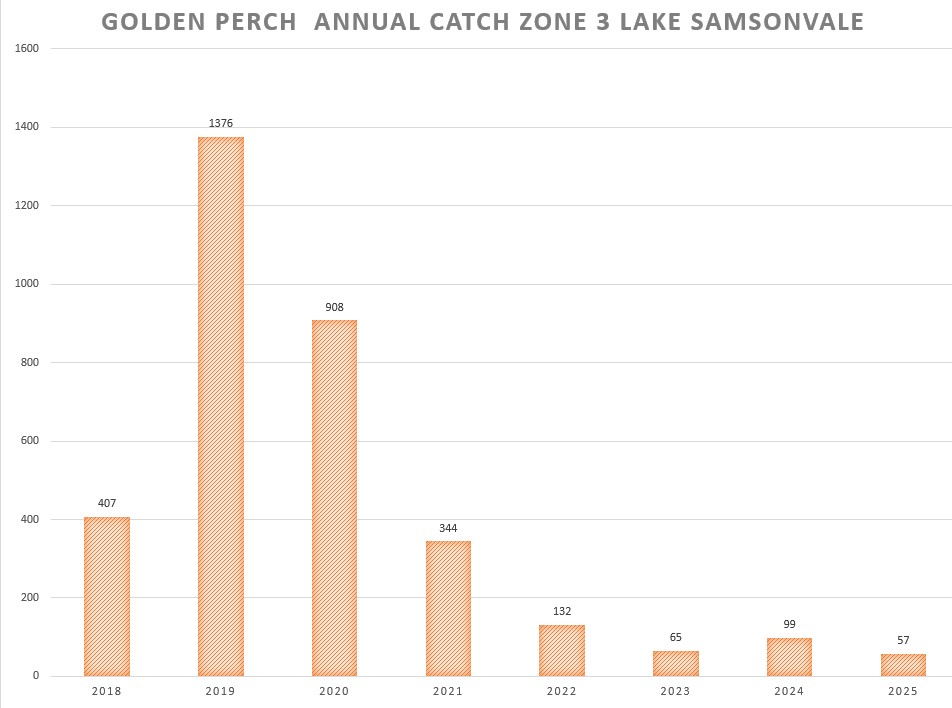
Golden Perch, affectionately known as “Yellas,” have been a part of the stocking efforts at Lake Samsonvale for many years. Despite this long history, very little data has been collected regarding the species’ population trends, catch rates, and overall performance within the fishery. To address this gap, a focused and structured data collection program has recently been initiated to gather more comprehensive information on this important species.
The following charts utilize the same type of analysis applied to the Bass population, providing insights into stocking efforts and catch results over time. However, due to the limited availability of historical data for Golden Perch, meaningful comparisons and trend evaluations are currently challenging. The absence of robust data from previous years highlights the importance of building a more extensive and reliable dataset to inform future management decisions.
It is hoped that, with sustained efforts in data collection, these datasets will grow significantly over the coming years. This expanded information will enable more accurate assessments of the Golden Perch fishery and facilitate better management practices. The ultimate goal is to ensure a thriving, sustainable fishery that meets the needs of anglers while maintaining the ecological balance of the lake. As data accumulates, this will allow for a more nuanced understanding of the species’ dynamics, supporting adaptive management strategies to optimize both stocking programs and angling success.
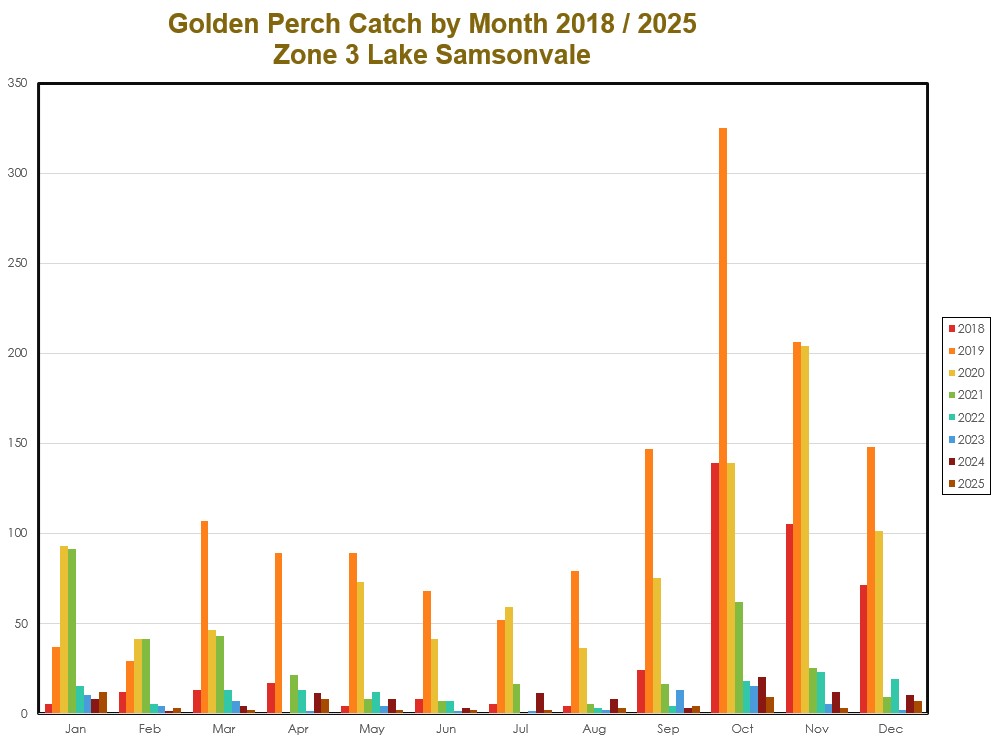
The most notable observation of the data is the lack of small fish (< 300mm) in the catch. From limited otolith collection, we do know that Golden Perch grow very quickly in Lake Samsonvale which might explain the limited catch of small fish.
Habitat Enhancement Program
The Pine Rivers Fish Management Association (PRFMA) has been actively working to enhance and sustain the Lake Samsonvale fishery through a variety of initiatives, including the installation of Fish Aggregating Devices (FADs). These structures are designed to attract and concentrate fish, creating hotspots for recreational anglers and improving the overall fishing experience. FADs also provide valuable habitat for various fish species, supporting their growth and survival.
To better understand the impact of these devices, the PRFMA is collecting detailed data on fish catches associated with the FADs. This information will help assess their effectiveness and guide future habitat enhancement efforts. The collected data will be analysed and made publicly available in due course, contributing to the transparency and collaborative nature of the PRFMA’s management practices.
However, there is a current concern regarding the reduced Full Supply Level (FSL) of the lake, which now stands at 68%. This lower water level means that many FADs are situated in significantly shallower water than originally planned. Shallower placement may alter the effectiveness of the devices and their ability to attract fish, and this situation is being closely monitored to assess potential impacts. Adjustments to FAD placement or future designs may be necessary to optimize their utility under the new FSL conditions.
For those interested in learning more, the PRFMA website offers a comprehensive description of the construction and deployment of the FADs. Visitors can find detailed information, including a map showing their precise locations, under the “Habitat Enhancement Program” section at www.prfma.com.au. This resource provides valuable insights into the PRFMA’s commitment to habitat enhancement and sustainable fishery management.
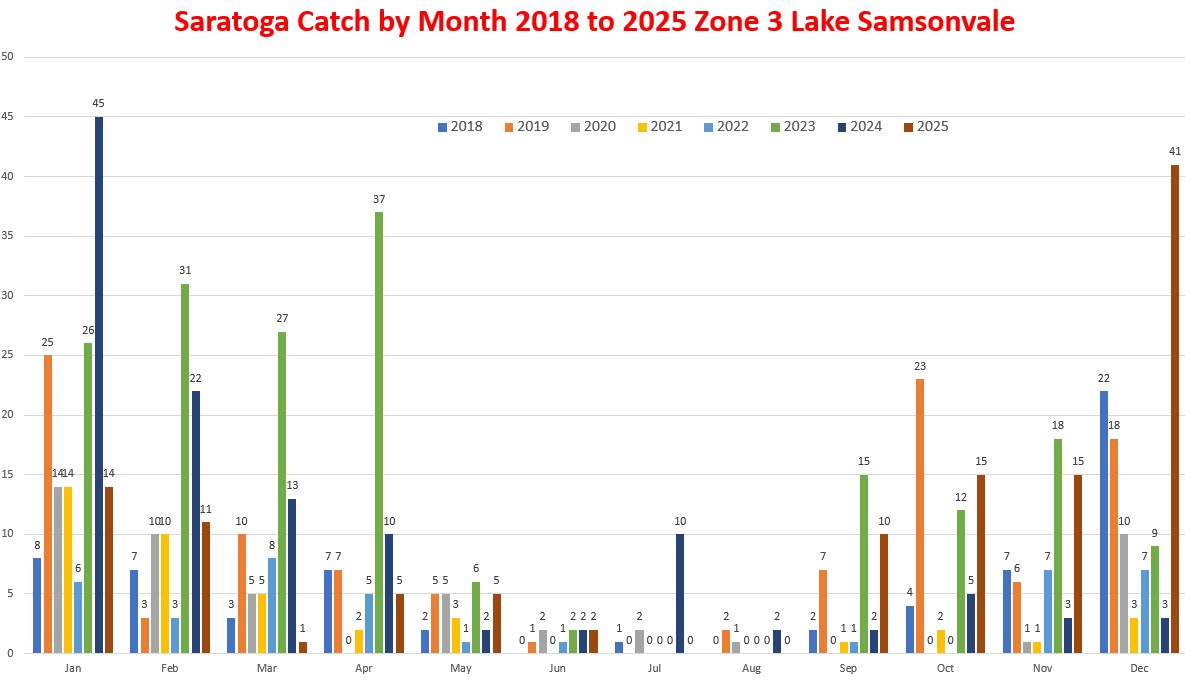
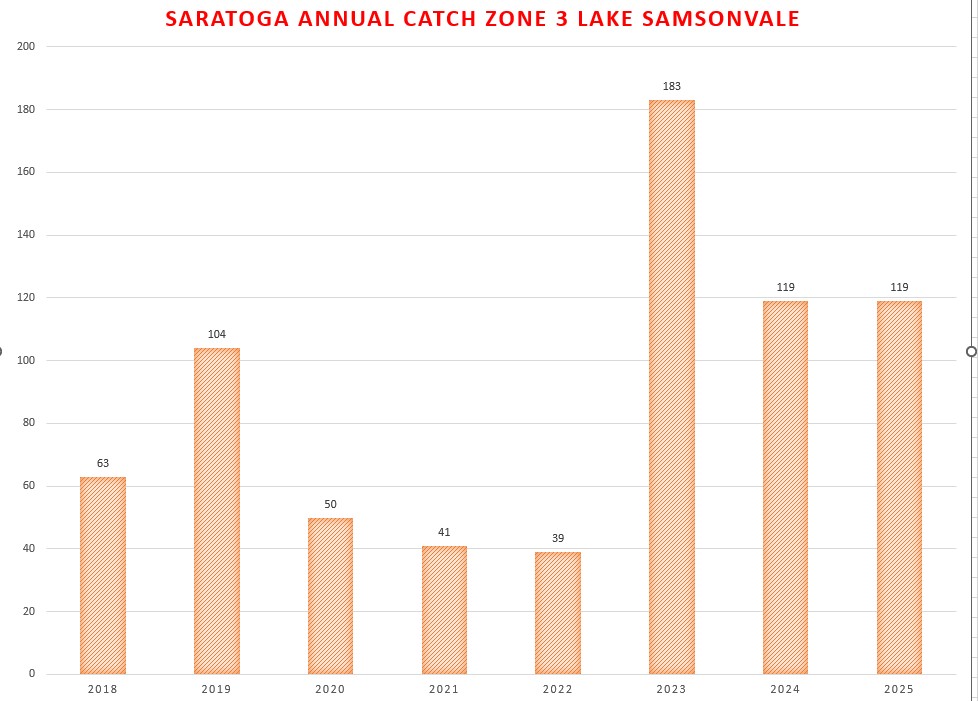
Saratoga Data
With a very limited catch of Saratoga, data analysis is difficult. However, a research project which involves tagging and tracking of Saratoga will hopefully provide more data in future
We encourage and greatly value your comments and observations regarding the data presented here. Your feedback plays a crucial role in helping us refine our understanding of the fishery and improving the effectiveness of our monitoring and management programs. Whether you have insights into the trends displayed, ideas for new data collection methods, or suggestions for enhancing the monitoring program, we would love to hear from you. Constructive input from the community is vital to ensuring that our efforts continue to align with the needs of anglers and the sustainability of the fishery.
A special note of appreciation goes to the dedicated members of the Pine Rivers Fish Management Association (PRFMA) who have worked tirelessly to collect and record the data presented. This work would not be possible without the commitment and enthusiasm of our volunteers, and we extend our heartfelt thanks to each of you. We would like to acknowledge and thank Mick Dohnt for his exceptional diligence in maintaining the databases and ensuring the accuracy and integrity of the information collected. Your efforts make an enormous contribution to the success of this program and the ongoing health of the fishery.
If you are a PRFMA member or a VPS Permit Holder and are interested in becoming involved in the data collection program, we warmly invite you to join us. Your participation is an excellent opportunity to contribute directly to the improvement of the Lake Samsonvale fishery and to engage with others who share your passion for recreational fishing and conservation. To get involved, please do not hesitate to reach out and drop us a line at info@prfma.com.au . We look forward to working together to ensure the long-term sustainability and enjoyment of this beautiful fishery for generations to come.