Lake Samsonvale Stocking History
Stocking commenced in Lake Samsonvale in 1991 and has been managed by the PRFMA to produce and first class fishing location offering a great variety of options for the novice angler right through to the experience veteran.


Since 1990 the following fingerlings have been released into Lake Samsonvale
2,232,058 Australian Bass
1,124,748 Golden Perch
  449,624 Silver Perch
 56,550 Mary River Cod
    710 Saratoga
Details of Fingerlings stocked in the 2025/26 Season.
LAKE KURWONGBAH
27.000 Australian Bass and 24,000 Golden Perch (Yellow Belly)
LAKE SAMSONVALE
62,000 Australian Bass
35,000 Golden Perch (Yellow Belly) and 600 Mary River Cod
The efforts of the volunteers from the PRFMA will maintain Lake Samsonvale and Lake Kurwongbah as sustainable recreational fisheries for the benefit of the general public.
Lake Samsonvale Stocking Update
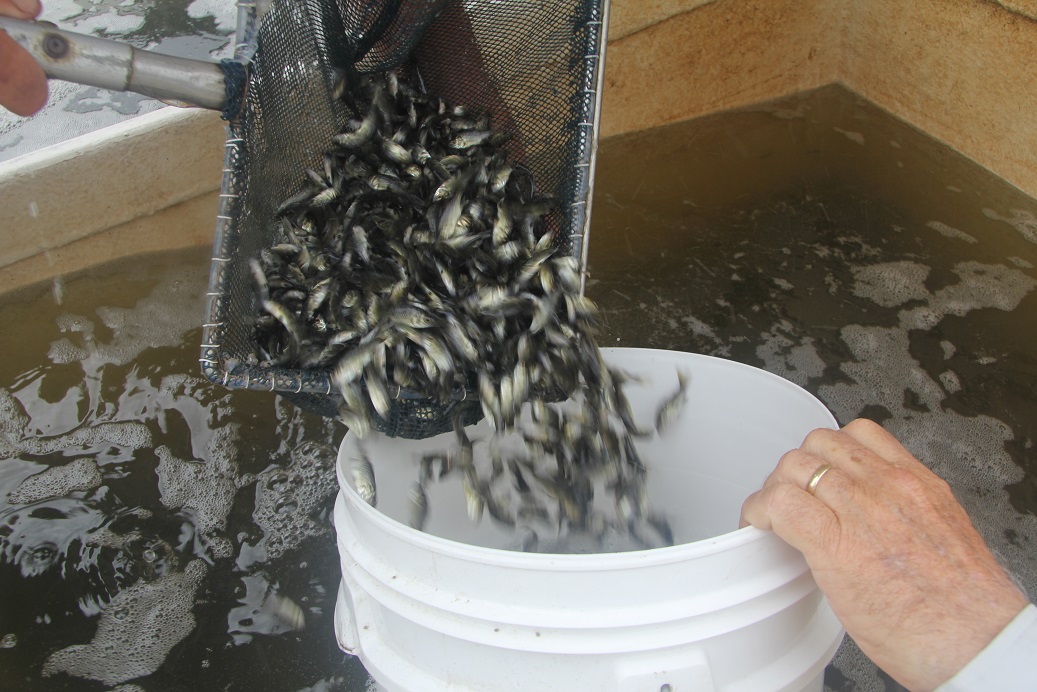
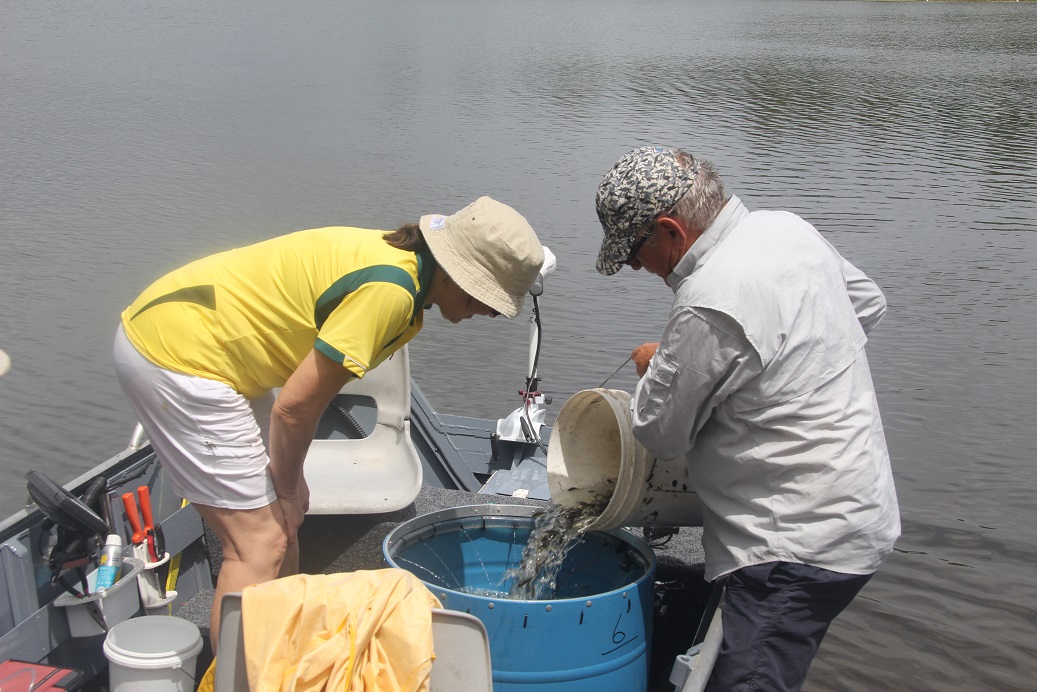
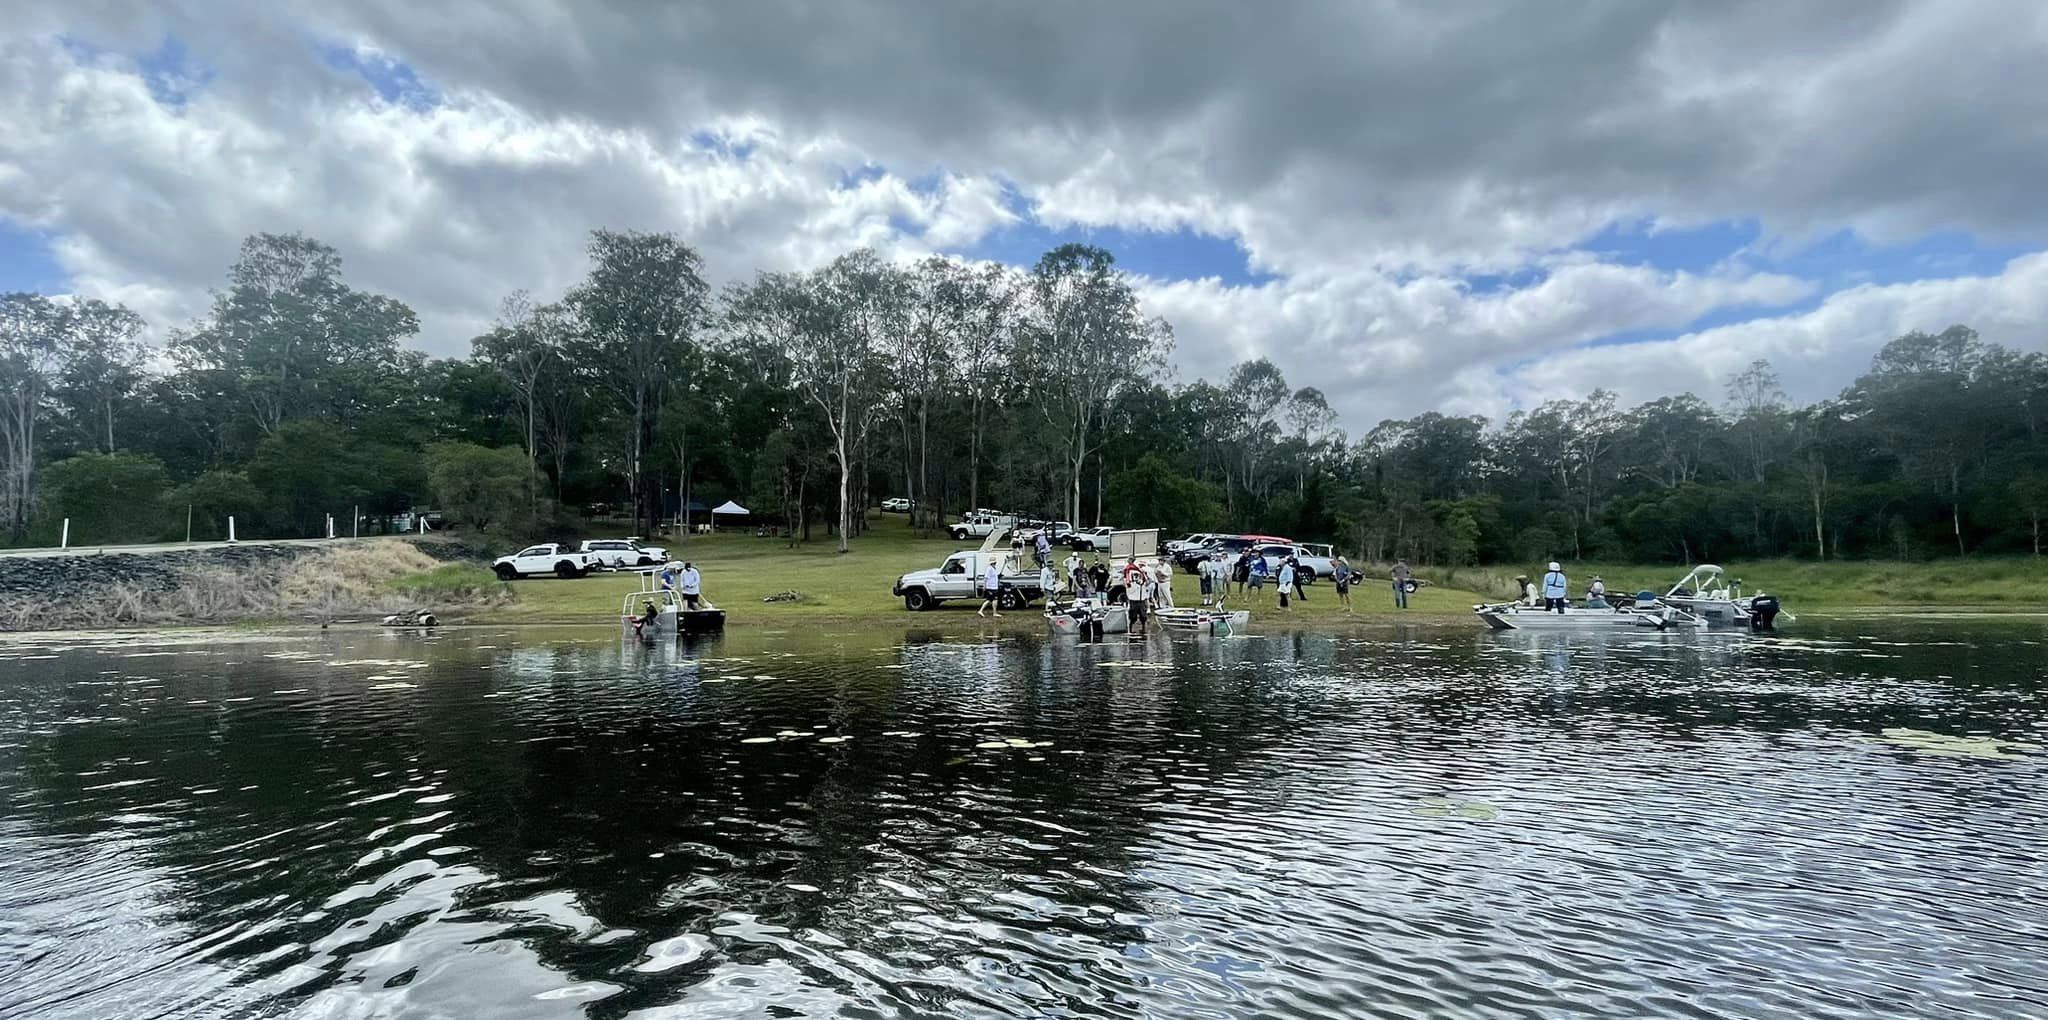
14/12/2025 Where 7 Vessels released 62,000 Australian Bass Fingerlings to various parts of Lake Samsonvale. 20 PRFMA volunteers assisted with the release. CMB Councillor Cath Tonks (Div 9) participated in the release. Hanwood Fish Hatchery supplied the fingerlings in excellent condition. We thank all attendees for their support and for their assistance with the release.
The scattered release will ensure a higher survival rate of the fingerlings which will therefore help to maintain Lake Samsonvale as a premium Bass Fishery
Video – https://www.youtube.com/watch?v=aU02VMmZsao Lake Samsonvale – Australian Bass fingerling release
The involvement PRFMA volunteers, is commendable. Such collaborative initiatives play a crucial role in maintaining the biodiversity and sustainability of aquatic ecosystems.
The decision to scatter the release across various parts of Lake Samsonvale is a thoughtful approach. This strategy can indeed contribute to a higher survival rate for the fingerlings, ultimately supporting the goal of maintaining Lake Samsonvale as a premium Diversified Fishery.
It’s important to acknowledge the dedication of the volunteers and the support of local officials in environmental conservation efforts. Their contributions will likely have a positive impact on the overall health and diversity of the lake’s fish population. Thank you to everyone involved for their commitment to the well-being of Lake Samsonvale and its ecosystem.
The City of Moreton Bay – CMB has provided a contribution payment to our organisation our fish stocking program. The fingerlings released are also funded by the State Government Stock Impoundment Scheme (SIP) Grant.
Lake Kurwongbah Stocking History
The fish stocking program for Lake Kurwongbah was able to be commenced after PRFMA successfully applied for and received funding from the Federal Department of Agriculture, Fisheries and Forestry’s recreational fishing community grants program. Moreton Bay Regional Council also contributed some initial funds and continues to supply funds each year to allow restocking of the lake.
The focus for this lake will be to produce a Australian Bass, Golden Perch and Saratoga fishery.
Fingerlings are sourced from various sources around southern Queensland. The fish are delivered by accredited fish breeders in purpose-built transport tankers,
In 2008, PRFMA members made four trips to collect stock, the longest trip was over a thousand kilometers and required a couple of days of travel, harvesting and distribution to collect some prime southern strain Saratoga. Even though wet, tired and dirty our guys bought back the basis of a breeding population which we hope will make Kurwongbah a fine Saratoga fishery in the years to come.
STOCKING UPDATE Lake Kurwongbah
27,000 Australian Bass Fingerlings were released from the shoreline and by Kayaks at Lake Kurwongbah Mick Hanfling Park on the 14/12/2025 and 24,000 Golden Perch in March 2026
PRFMA Volunteers, Guest Fishermen participated in the release.
The Fingerlings were supplied in excellent condition by Hanwood Fish Hatchery
The City of Moreton Bay – CMB – has provided a contribution payment to our organisation our fish stocking program. The fingerlings released are also funded by the State Government Stock Impoundment Scheme (SIP) Grant.

Since 2007 the following fingerlings have been released into Lake Kurwongbah
635,780 Australian Bass
142,343 Golden Perch
  1,200 Mary River Cod
    760 Saratoga
    530 Snub Nosed Garfish